


How to Interpret Column Interaction Diagram
In the modern world of structural engineering, there’s a lot of structural software that can we use in structural designing. Although they are considered tools to speed up the process of structural designing, we make sure that the design principles behind them are also within our thoughts.
Previously, as we talk about the Column Design Principles in our previous post, we found out that a lot of things to consider in the column design. It is always okay to consider the first assumption that we learn in the previous article to get the number of bars in the column we are designing which is the 1 to 8 percent ratio of reinforcement to the gross area of the column. But Column design makes it even more complicated when there is an eccentricity or bending being considered. This tends the designer to rely on structural software to analyze it easier, oops we are not going to talk about what are the different software that can be used in column design because I am sure you already knew about it. We are here to discuss the column interaction diagram. Perhaps the most practical way for a column design is to analyze the column interaction diagram, but how we are going to interpret it?
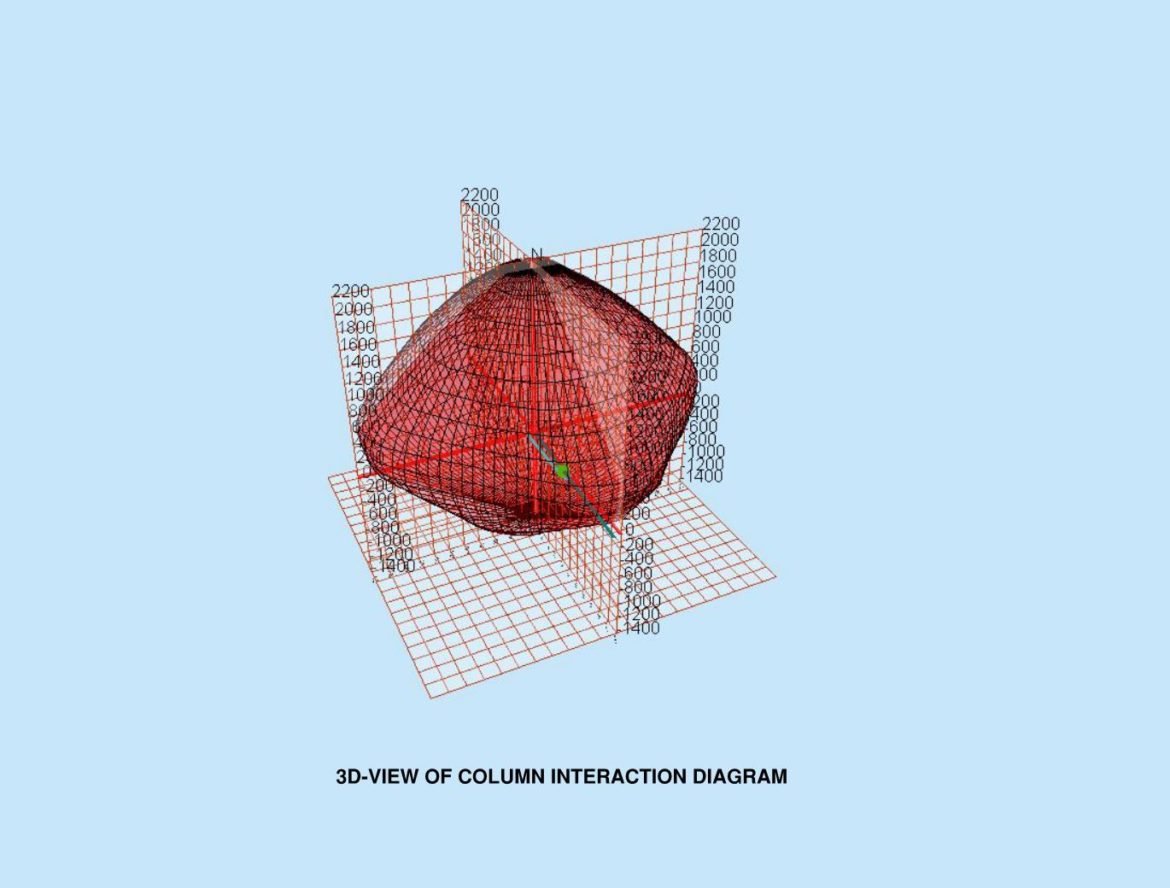
An interaction Diagram in a column is a graph that shows a plot for the axial load Pn that a column could carry versus its moment capacity, Mn. This diagram is very useful in analyzing the strength of the column which varies according to its loads and moments. This can easily be interpreted as: the load combinations under any case that falls inside the curve are satisfactory while the load combination under any case that falls outside the curve represents a failed design.
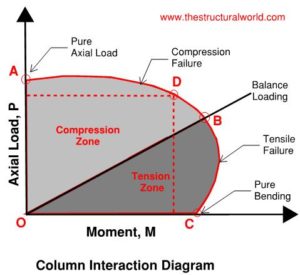

The diagram is made by plotting the axial load capacity of the column at point A, then the balanced loading at point B, then the bending strength of the column. If it is subjected to a pure bending moment only at point C. In between points A and C, the column fails due to axial and bending moment combinations. Point B is called the balanced point. In reference to point D, the vertical and horizontal lines represent the particular load combinations of axial load and moment.
Tell us your thoughts! Feel free to leave your comment below and subscribe to our newsletter for any updates.
![]()


i want to be best engineer how